
Know your rental's income and cash flow before you decide.
Order a rental report for your home: what it could rent for,
and the net operating income it generates.
Choose a Long-Term Rental Analysis with live comparable rentals, a Rental Strategy Comparison of long-term vs short-term renting, or both ($19 each, or both for $29).
What you get in a Long-Term Rental Analysis
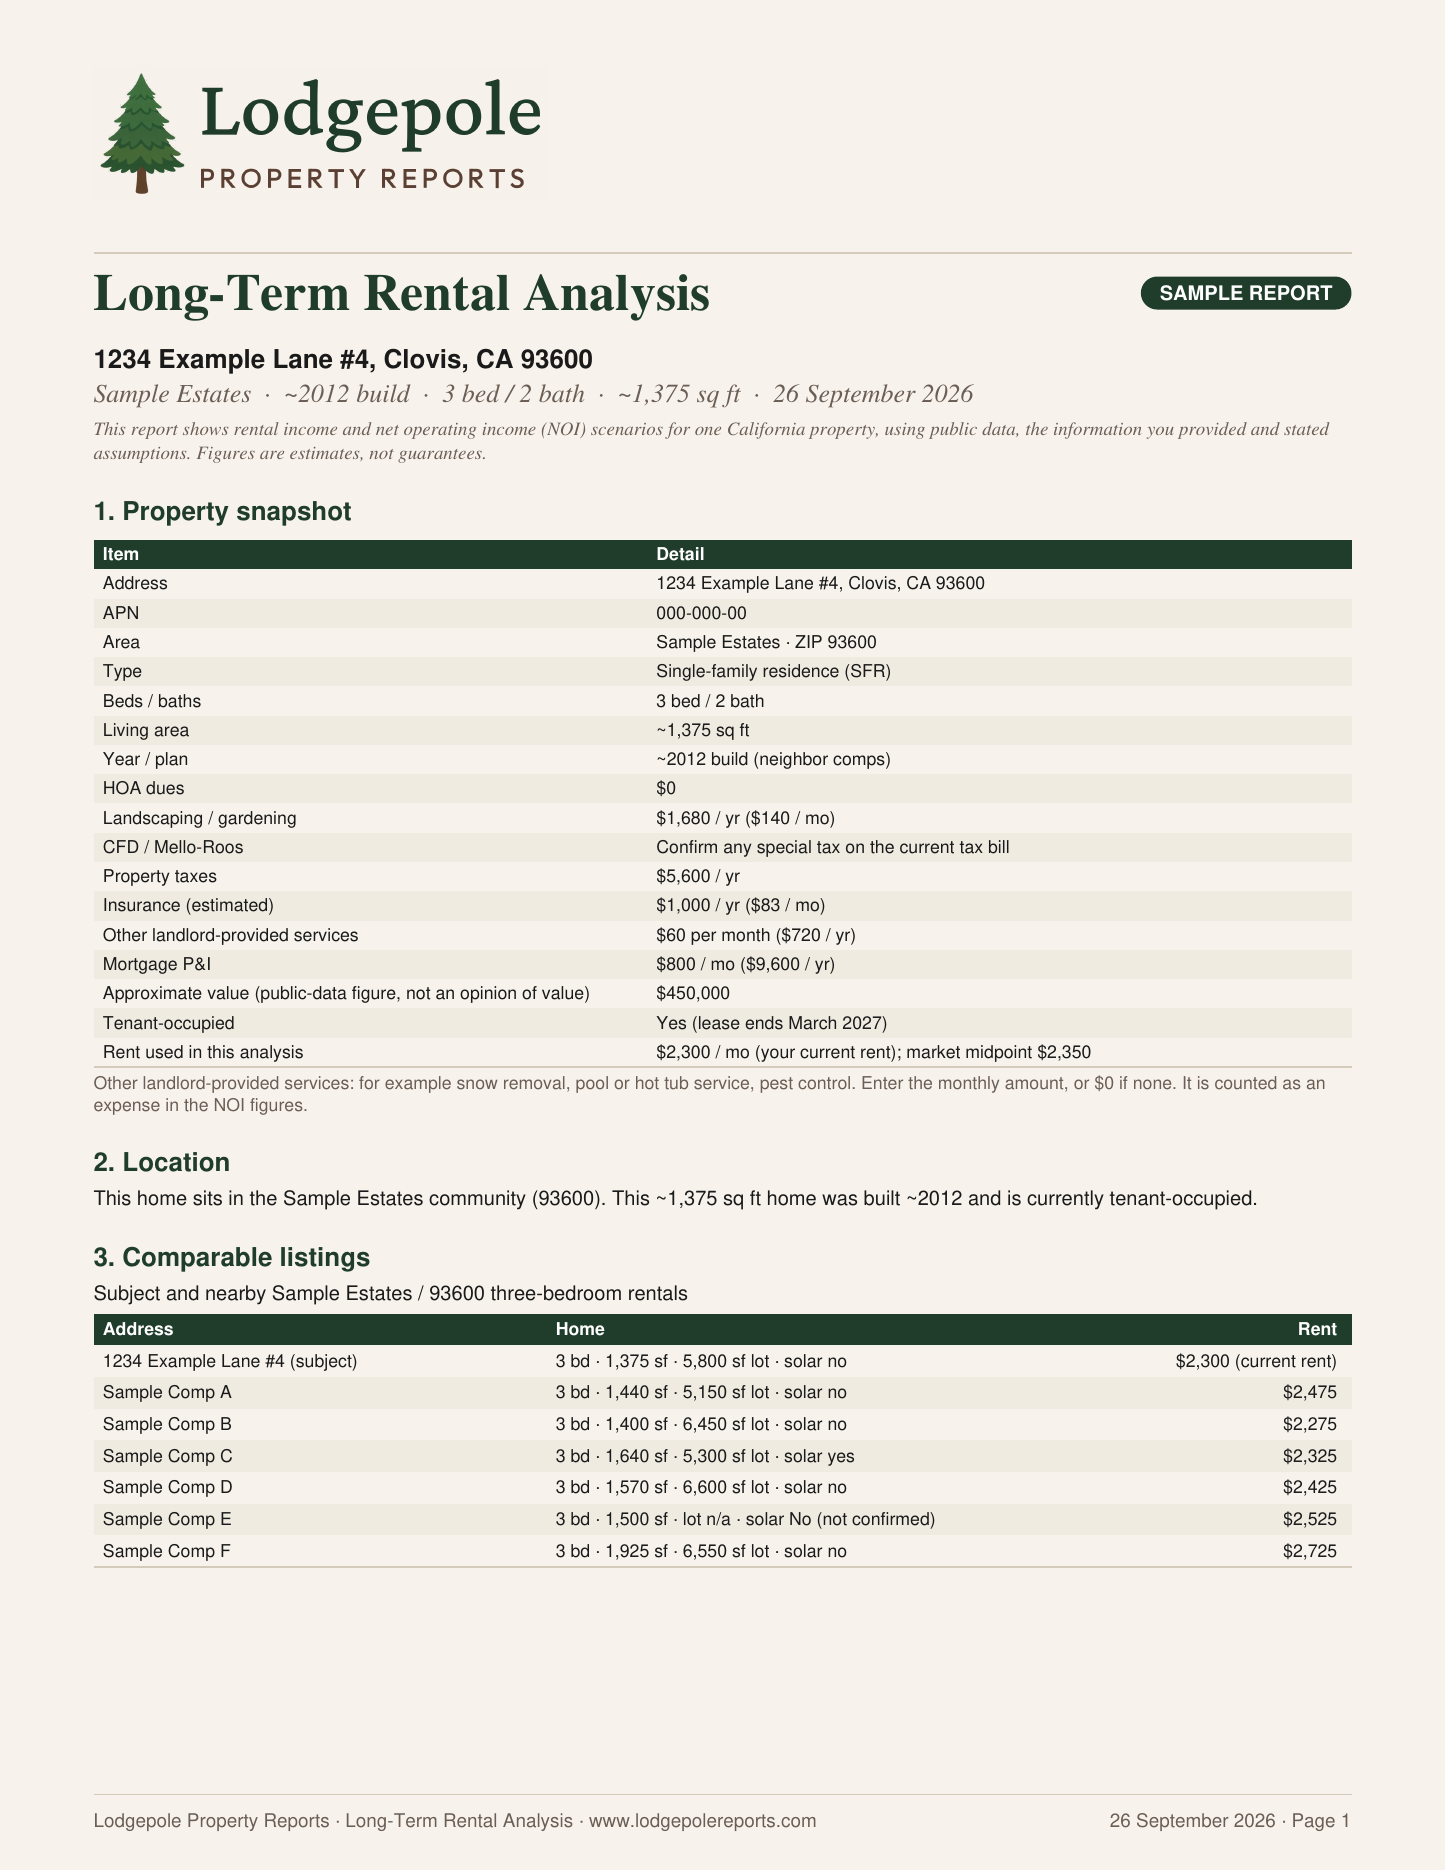
A rent range from recent rentals, how your rent compares, and your net income and cash flow.
Rent range and midpoint
A rent range backed by recent comparable rentals near your home, with the midpoint used as the assumption for the figures.
Your rent vs market rent
Already have a tenant? See the market rent range for your home and how the rent you are getting compares with it: the dollar and percent gap per month and per year, and where your rent sits in the range. If you enter an asking rent because the home is listed for rent, the report compares that asking rent to the market rent instead of your current rent. The profit and loss is then built on the midpoint of the comparable rents.
Current rent comps
The recent comparable rentals behind the figures, with beds, baths, size and rent, so you can see where your number comes from.
Net operating income (NOI)
Rental income less vacancy, taxes, insurance, HOA, maintenance and reserves, shown annually and monthly. Property management fees vary, so the report shows NOI at three sample fee levels. Illustrative, not quotes.
Your cash flow
If you enter your mortgage payment (principal and interest), the report shows your cash flow after that payment, along with monthly and annual NOI. With no mortgage payment entered, the report shows NOI only.
General information, not legal advice. Figures are estimates, not guarantees. Any change in rent is subject to your lease and to California and local law.
What you get in a Rental Strategy Comparison
Long-term lease vs. short-term rental
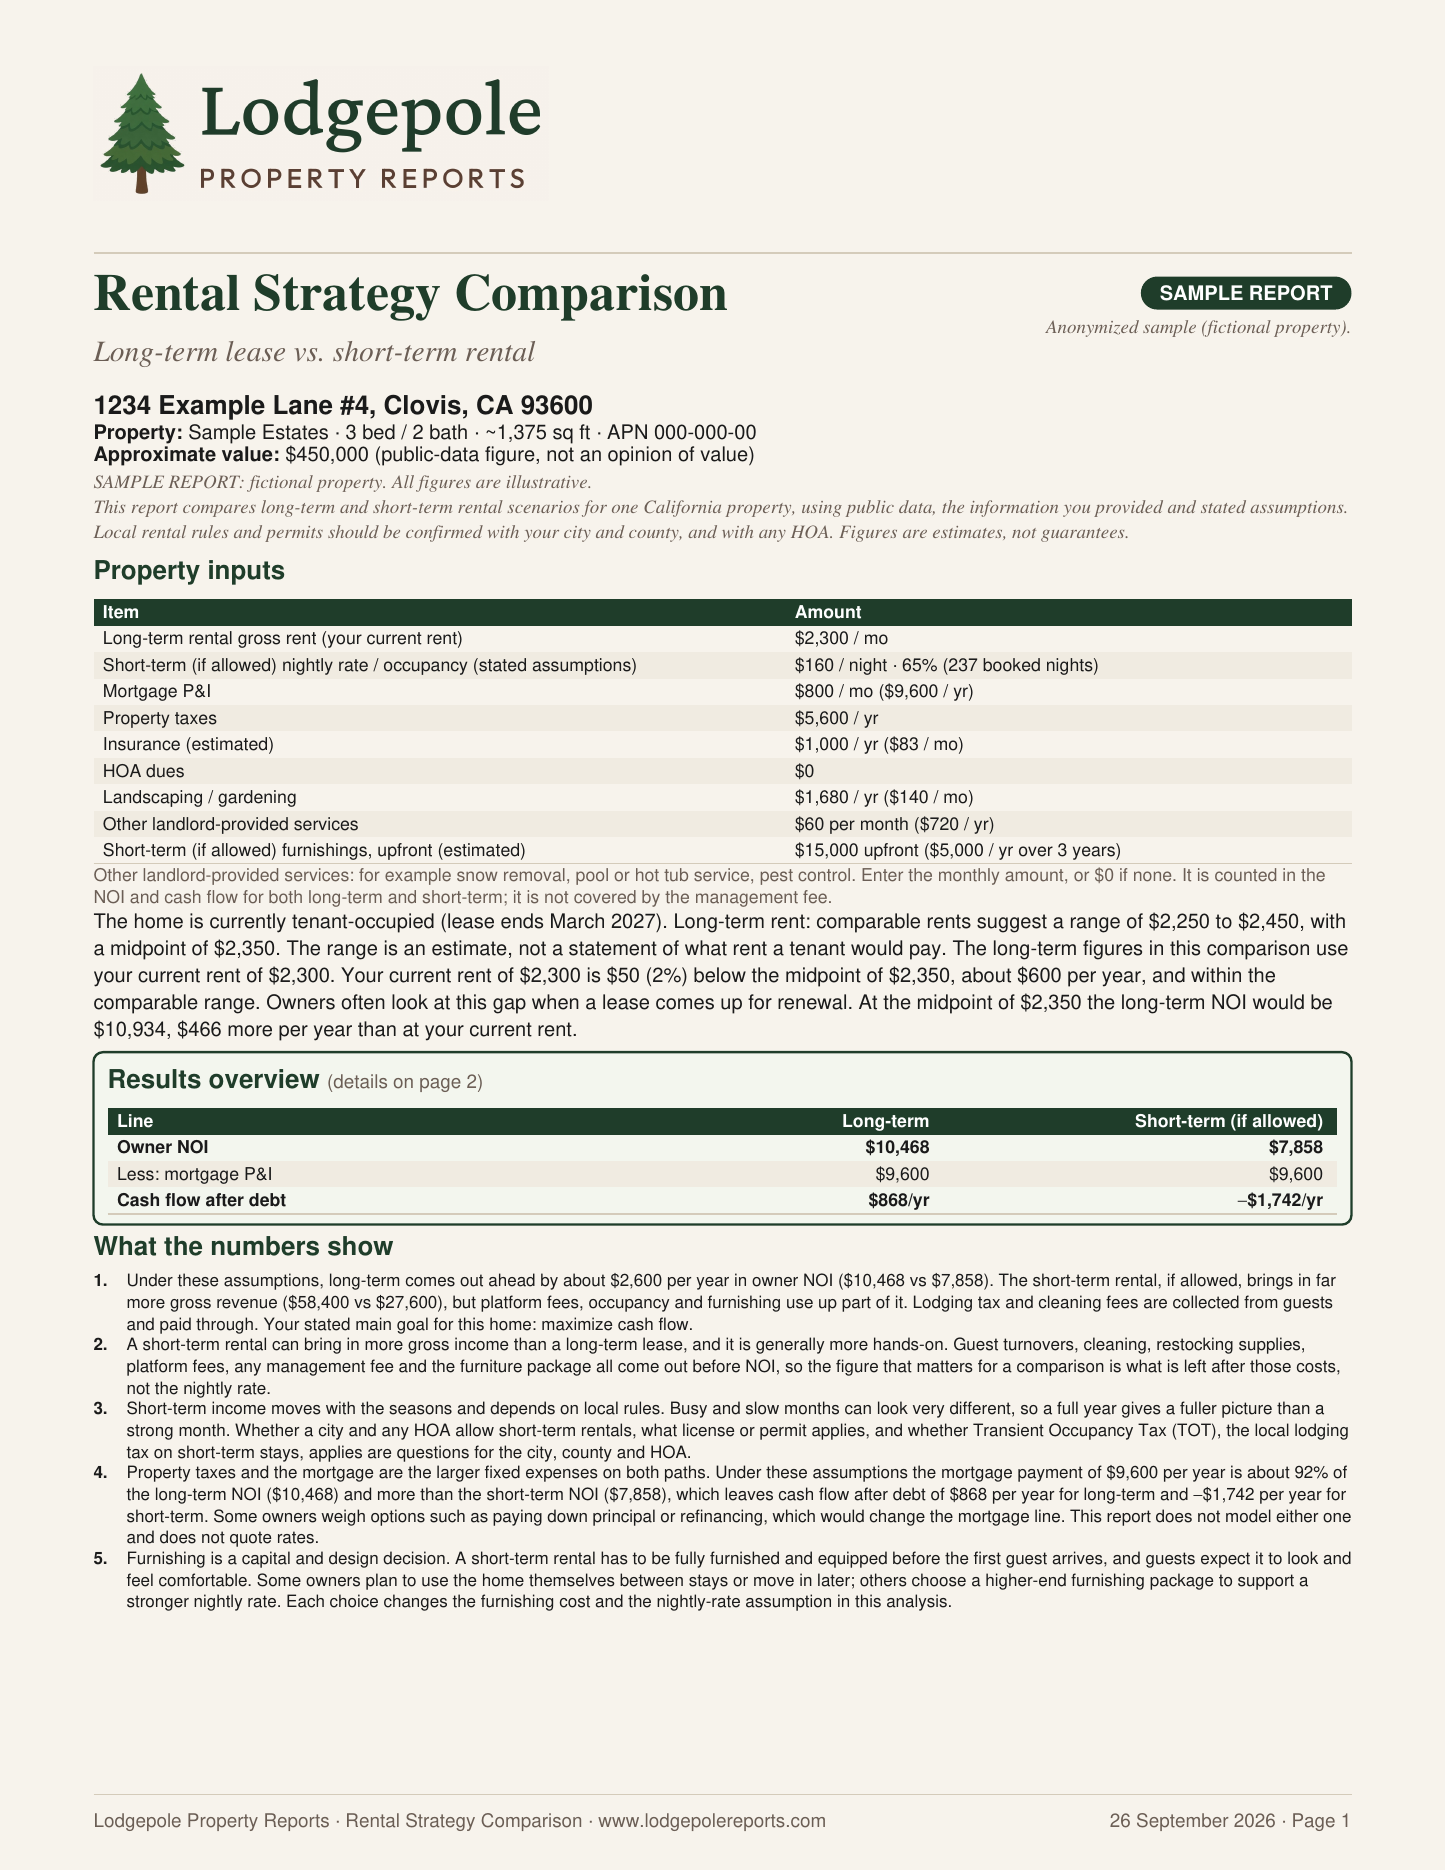
Long-term lease or short-term rental? See both options for your home side by side, with the income, the costs and the scenarios each one produces.
Property management fees are optional. They are included only if you choose common rates or enter your own percentage.
Long-term rental outlook
A long-term rent range with its midpoint. Net operating income (NOI) is calculated after vacancy, taxes, insurance, HOA and reserves, and after a property management fee only if you choose common rates or enter your own percentage. NOI is based on the midpoint of the comparable rents, with the range shown beside it.
Short-term rental outlook (if allowed)
An estimated nightly rate and occupancy for your home, the annual revenue those assumptions produce, and NOI after platform fees, cleaning, utilities, internet, extra insurance, any permit or license fee, and furnishing costs. Cleaning fees, lodging tax and the tourism assessment are shown as collected from guests and paid through.
Side-by-side NOI and cash flow
Annual and monthly NOI for both options, shown side by side. If you enter your mortgage payment (principal and interest), the report also shows cash flow after that payment, so you can compare which option leaves more.
Setup and options
A furnishing and setup budget (yours, or our estimate if you leave it blank), and the long-term and short-term options side by side so you can weigh them against your goals for the home.
General information, not legal advice. Figures are estimates, not guarantees. Local rental rules and permits should be confirmed with your city and county, and with any HOA.
Get both rental reports for $29
The Long-Term Rental Analysis and the Rental Strategy Comparison for one home.
Both rental reports include the Long-Term Rental Analysis and the Rental Strategy Comparison for the same California property, each with the scope described above.
More reports, coming soon
Rental Property Purchase Analysis
For an investor evaluating a home to buy and keep as a long-term rental. See what the property could earn before you make an offer.
Coming soonPurchase and Flip Analysis
For an investor evaluating a home to buy, renovate and resell. This report is planned to help you weigh a flip before you commit.
Coming soonOnline ordering isn't available for these yet.
How it works
- Choose a report. A Long-Term Rental Analysis, a Rental Strategy Comparison, or both for one California home.
- Tell us about the home. Enter the address and anything you know. Anything marked "we'll research if blank" is researched from public data.
- Pay securely. Checkout is on Stripe's secure page. $19 for one report, or $29 for both.
- Get your report by email. Delivered within hours, and usually much sooner.
Questions
Which homes can you report on?
One California home per report. Lodgepole Property Reports are available for California properties only.
What do I need to order?
The street address, city and ZIP, your name and how to reach you, and a few quick questions about the home (your main goal, whether it has a tenant and whether it is listed for rent). The rest is optional. Anything marked "we'll research if blank" (property taxes, insurance, HOA dues and similar) is researched from public data.
How fast will I get it?
Your report is emailed to you. It is delivered within hours, and usually much sooner.
How much does it cost?
$19 for a Long-Term Rental Analysis or a Rental Strategy Comparison, or $29 for both on the same home. Checkout is on Stripe's secure page.
Can I rent my home short-term in my city?
It depends on the city. Some allow whole-home short-term rentals with a permit, some allow them only in the host's primary residence, and some require a minimum stay of 30 nights or more. The Rental Strategy Comparison looks up your city's lodging tax and rental rules for each order. In a city that sets a minimum stay, the short-term column is based on that minimum (for example "Short-term (31-night minimum)"). Where even that is not allowed, the column is marked "not allowed by city" and the short-term figures are for comparison only. Always confirm the rules with your city and county, and with any HOA.
Does the report tell me what my home is worth?
No. Reports give no opinion of a property's value and no list price. They show rent, costs, net operating income and cash flow under stated assumptions. Both reports list an approximate home value as an input to those numbers. It's either the estimate you enter when you order or, if you leave it blank, a figure pulled from public records and market data. It is not an appraisal or a statement of what your home is worth.
Is this financial or legal advice?
No. Lodgepole Property Reports are general information about one property, not investment, financial, tax, legal, lending or insurance advice. Figures are estimates, not guarantees.
What if something is wrong or my report is late?
See our Refund Policy, or email reports@lodgepolereports.com.